

The COVID Lockdowns Were a Breath of Fresh Air for Bangalore
The COVID Lockdowns Were a Breath of Fresh Air for Bangalore
If only they weren't laced with anxiety, death and loneliness.

So, what did Shooby Do this week?
He felt intense climate anxiety due to this article and explored Bangalore’s Climate Data to look for a sliver of hope to break himself out of it. Spoiler alert: It didn’t work.
The code for this analysis can be found here.

In short, the article reflects upon the WHO’s new guidelines for air quality and threshold levels for particulate matter in the air, which if regulated thoroughly could reduce deaths caused due to PM2.5 by 80%, according to a rapid scenario analysis performed by the WHO.
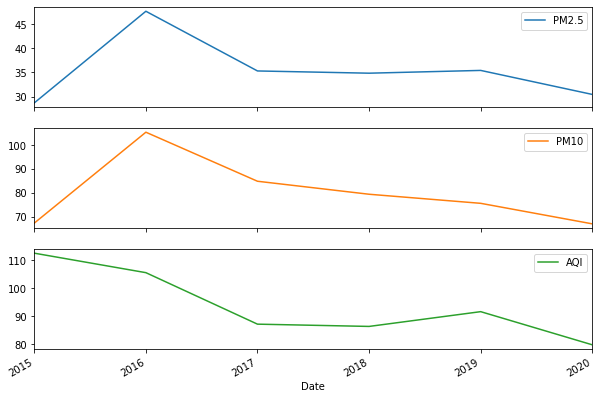
The new guidelines set the threshold at an annual average of 5 μg/m3 for PM 2.5, and 15 μg/m3 for PM 10. I suppose it’s starting to become clearer as to why parsing through the data didn’t do my anxiety any favors. In the above chart, we see that in none of the years* did the average values for PM 2.5 go below 30, which is now 6 times the recommended limit, and the values for PM 10 go below 70, which is about 4/5 times the threshold. The biggest kicker here is that this is probably due to the fact that India’s National Ambient Air Quality Standards (NAAQS) are more lax than even the old WHO guidelines with the thresholds set at 40 and 60 (which we still failed to maintain in any of the last 5 years), respectively.
* 2015 has missing data for PM 2.5 and PM 10 and thus the actual average for the year is mostly much higher.
Since 2020 seemed to be the best performing year, I looked at the data for that year specifically, and on first glance it became pretty clear that a lot of the improvements in air quality came about as a consequence of the travel restrictions designed to curb the spread of COVID-19. However, being the data guy™ that I am, I couldn’t just rely on my eyes to jump to conclusions, I had to use the numbers to infer them.
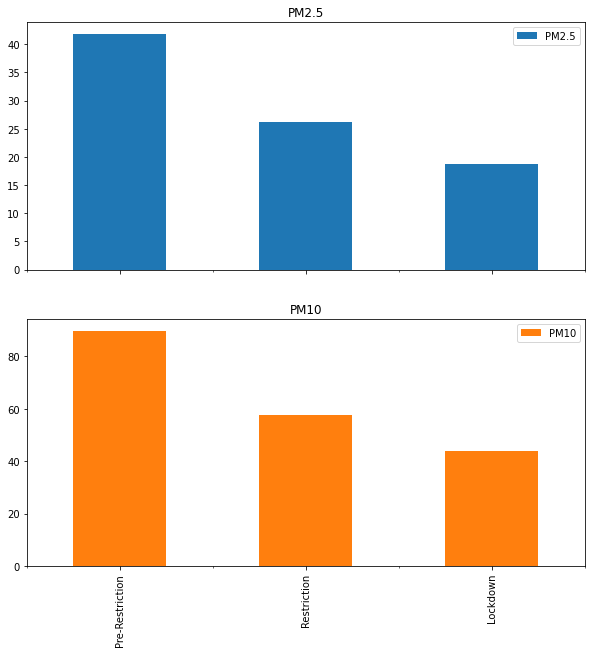
So I did, and suffice to say, my eyes didn’t betray me. In the above chart, the data has been grouped into 3 categories:
Pre-restriction: From 1st Jan to 9th March. This was the period where a lot of people knew about the virus, but there was no travel restriction or closure of public spaces by the government.
Restriction: From 10th March to 23rd May. This was when first schools, then malls, universities and soon most other high footfall places were shut, significantly reducing travel within the city.
Lockdown: From 24th May. This was when the government enforced a complete lockdown where all non-essential travel within the city was banned.
As clear as day (pun intended), when looking at the chart we can see significant, but also rapid improvement in the particulate matter indices of the city. This tells us that restricted movement across the City is a means to tangible improvements to the quality of the air we breathe and consequentially, our respiratory health.
The results presented above are pretty significant but are they statistically significant? Statistical significance is important, because it acts as a distinction between outcomes as a consequence of chance, or as a consequence of the factor one is trying to study. To derive statistical significance I decided to approach this problem in two ways, one slightly more traditional than the other.
Method 1: Hypothesis Testing.
Some preliminary notes before the hypothesis test:

The Air Quality Index was used instead of PM 2.5 or PM 10 due to missing data with the latter and AQI showing high levels of correlation with both these values.
The data was split into Pre and Post restriction (10th March 2020) only since it makes the analysis easier while still getting my point across.
The test used in this situation was the one-way F-Test, as part of the ANOVA tests, which is used to determine significant differences between two or more groups.
Null Hypothesis: There is no statistically significant difference between the average AQI before and after March 9th 2020.
Result: The one-way ANOVA returned a p-value of 0.0003, which in other words means that there is a 0.03% chance of this variance between the two groups being due to chance and not due to our factor. Since the value of p is below 0.01, we reject the null hypothesis and claim that the results are statistically significant at a 0.01 level, which is just a fancy way of saying very significant.
Before we jump into the final method, during this project, I wanted to plug a very cool GitHub repository that you should definitely check out and I guess while you’re on there you should check mine out too!
The OpenBangalore repository has a host of data relating to the wards in the city, and with the help of some geospatial analysis, the AQI data was mapped to specific wards, as shown below: (TIP: use the header image for the names of specific wards)

We see that the infamous Silk Board and the City Railway Station on their best days had a relatively high AQI of 35.

Whereas on their worst days it was actually Marathalli, that displayed the most pollution. This could be due to the rapid industrial development in the area.

Finally, we look at the change in AQI from March 10th 2020. City Railway Station, perhaps due to the lack of trains during the lockdown showed an incredible improvement of around 100 points. However Hebbal somehow got worse during this time period, perhaps this could be due to the airport getting flooded by the people hurrying home but further research would need to be conducted to conclude something like that.
Method 2: Forecasting.
Artificial Intelligence has taken over the tech landscape as everyone’s favorite buzzword and not being immune to the same, I ran a fun (as fun as fear of respiratory diseases get) little experiment with some neural networks, the scope of which was:
Using data from before the first curfew, create a model and make a forecast for the temperature until the present day.
Now using data from after the curfew, make new predictions until the present day.
The data was aggregated to the weekly mean of AQI, and scaled to a range of -1 to +1 to ease computational load.
Compare both predictions and see the improvement.
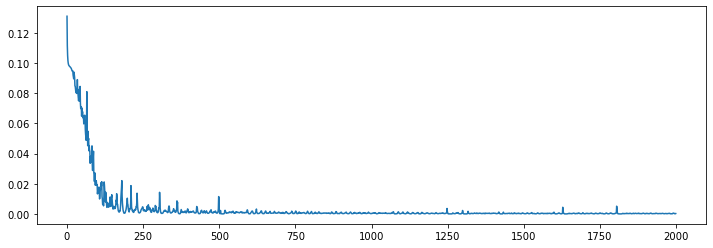
Long-Short Term Memory Neural Networks were used for this test as their ability to retain sequential information makes them ideal for Time-Series Forecasting.
Result:
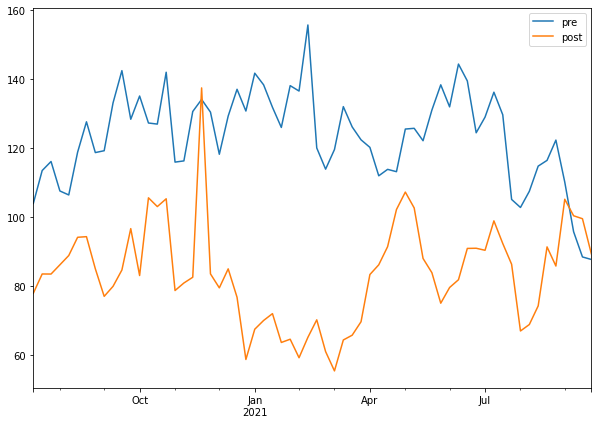
As the graph above shows us, when forecast using the post lockdown data, the projections are significantly better (by 35 AQI, on average). While this isn’t exactly the most robust way to prove a point, it shows us that with 4 months of restricted travel, the projections for air quality for the next ~2 years improve significantly.
Conclusion:
The quality of air we breathe is crucial, not just to prevent disease but rather to thrive and experience the world around us for all the beauty that it is worth. Using the lockdown as an experimental setup, acting as a substitute for a hypothetical situation where millions of people are not dying but the number of automobiles on the road are lower, fewer trains and planes are functioning, etc., this post aims to showcase that restricted travel can significantly and rapidly improve at the very least, the quality of air we breathe on a daily basis.
In the period between March 9th and May 24th of 2020, travel was not restricted but it was limited as a consequence of places with massive footfalls being shut, and even in this setup the PM 2.5 content in the air went from ~42 to ~25. While that is still a long way away from the 5 that can help us match the WHO’s updated guidelines, it will likely be a big step nonetheless.
So what I’m trying to say is that maybe the next time it feels like small steps like carpooling are insignificant in the grand scheme of things, this post can serve as a reminder that they aren’t.